As users and business activities generate data that is stored in SQL Server, the possibility for data skew increases. For the purposes of this conversation, data skew can be generally characterized as significant variance in frequencies of values in a column. Admittedly, the significance of the variance depends on factors such as data size and/or the informed subjectivity of the analyst. To illustrate, I’ll use some data from a recent SQL Saturday (#297) presentation I did on backup throughput analysis.
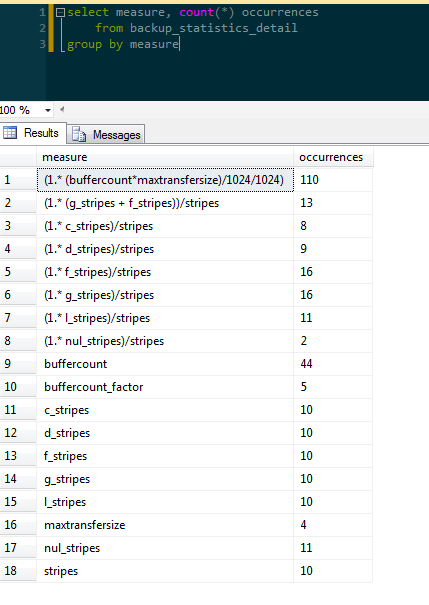
I have a table called [backup_statistics_detail] in which I stored pre-aggregated descriptive statistics for backup times as a function of a variety of independent variables. There are 309 rows in this table and a simple count of each value in a particular column ([measure], in this example) would seem to indicate skew because of what appear to be wildly-varying frequencies within the distribution (f=2,f=110).
We could get a bit more geeky to help us, as the analysts, make decisions about where skew may exist. Here we get our metrics: raw frequency (f), relative frequency (v), the average frequency of the set, the standard deviation of the frequency of the set, and the z-score. The z-score measures how many standard deviations from the mean a data point lies and a good rule of thumb is that in a normally-distributed data set, 95% of the data will fall within +/- 1.96 standard deviations and anything outside of that would be considered an “outlier.” We’re interested in the outliers.
select
	*,
	avg(1.*f) over () avg_freq,
	stdevp(1.*f) over() stdev_freq,
	(f - avg(1.*f) over ())/stdevp(1.*f) over() z_score
 from (
			select
				measure,
				count(*) f,
				100.*count(*) / d.n as v, --nu is the relative frequency
                                d.n
				from backup_statistics_detail bsd
				cross apply (
								select count(*) n
								from backup_statistics_detail
							) d
			group by measure, d.n
		) base_agg
          order by abs((f - avg(1.*f) over ())/stdevp(1.*f) over()) desc

From this query we see that there is a value that really sticks out at us: ‘(1.* (buffercount*maxtransfersize)/1024/1024)’. This measure occurs significantly more frequently than other values in the set.
To translate this into the SQL Server notion of statistics and the statistics histogram, the value for [measure] would be equivalent to [RANGE_HI_KEY] and the value for [f] would be [EQ_ROWS]. Note that to fully equate the two, we’d need to sort by [measure] ASC.
dbcc show_statistics(backup_statistics_detail,measure);

However, we noted that there were only 309 total rows in this table in the first place and we can see that there are only 18 distinct values currently in the table. We know that there are 200 possible “steps” in a SQL Server statistic histogram so we’ve got room to accommodate new values and their relative distribution. Thus, skew in SQL Server statistics parlance is a bit more nuanced than simply saying that a value falls outside of the boundaries. Now we’re looking for something that doesn’t currently fit, and won’t fit into the histogram. For example, I also have a table called [backup_observation] that recorded all of the events collected during a backup with an [event_timestamp] column. Of the 5,555,987 rows in this table, there are 901,900 distinct values for [event_timestamp].
To deal with these sorts of phenomena, filtered statistics were introduced with SQL Server 2008. We can create a new statistics object with its own histogram that will serve as a “window”, of sorts, between two values of a full histogram of a statistics object for a column with skew. Kimberly Tripp has an excellent presentation from the 2013 PASS Summit and a set of scripts to help analyze objects for skew. I took her logic and ran with it for my own environment (due to constraints surrounding deploying stored procedures here). It’s not perfect but you’re welcome to go grab it and run it/fork it/modify it here: https://gist.github.com/swasheck/eb7eb5f5f135280824ef
So once created, how do we know that the filtered statistics are actually being used to guide query plan creation? Paul White has an excellent post about using trace flags to find the statistics used to compile an execution plan. Using this information, I put together the procedure to check to see if the filtered stats that I implemented were being used, because we have tables that show evidence of significant skew.
Enable the trace flag and write to ERRORLOG:
dbcc traceon(9204,3605,-1);
(since this writes quite a bit of information to the ERRORLOG, we need to watch our free space on disk.)
In order to not duplicate data, I cycled ERRORLOG and then read the log into a table.
IF NOT EXISTS (SELECT 1 FROM sys.tables WHERE name = 'stats_usage')
BEGIN
	CREATE TABLE dbo.stats_usage(
		logdate datetime NULL,
		processinfo sysname NOT NULL,
		text nvarchar(max) NULL
	);
END
GO
exec sp_cycle_error_log
GO
insert into dbo.stats_usage
	exec sp_readerrorlog 1
GO
To get a sense for which filtered stats were being used, I used the following query to aggregate the ERRORLOG dumps:
declare @dbname sysname = 'dbname';
with sta as (
select
	su.logdate,
	su.database_name,
	su.object_name,
	s.name stat_name,
	su.column_name,
	su.filter_expression,
	s.filter_definition
	from (
			select
			logdate,
			SUBSTRING(text,32,3) database_name,
			SUBSTRING(text,46,CHARINDEX('IndexId',text)-48) object_name,
			SUBSTRING(text,CHARINDEX('IndexId',text)+9,CHARINDEX('ColumnName:',text)-(CHARINDEX('IndexId',text)+11)) index_id,
			SUBSTRING(text,CHARINDEX('ColumnName',text)+11,CHARINDEX('Expr:',text)-(CHARINDEX('ColumnName',text)+13)) column_name,
			SUBSTRING(text,CHARINDEX('Expr:',text)+5,CHARINDEX('EmptyTable:',text)-(CHARINDEX('Expr:',text)+8)) filter_expression
			from dba.dbo.stats_usage
			where text like 'Filtered stats loaded: DbName: '+@dbname+'%'
		) su
	join sys.stats s
		on su.index_id = s.stats_id
		and object_id(su.object_name) = s.object_id
)

select
	stat_name, max(logdate) last_use, min(logdate) first_use, count(*) total_uses
	from sta
	group by stat_name
	having count(*) > 1
	order by count(*) desc
	option (maxdop 1, recompile);
Of course, you can use this for any stats by simply changing the [text] filter in the CTE.
